ThingConnect Pulse Quick Start
ThingConnect Pulse is a free, on-premises network availability monitoring solution designed specifically for manufacturing environments. It provides continuous monitoring of your critical IT/OT infrastructure with zero external dependencies - all data stays on your premises.
Key Features:
- Real-time monitoring of network devices using ICMP ping, TCP port checks, and HTTP/HTTPS requests
- Intelligent alerting with flap damping to prevent false alarms from temporary network issues
- Historical data with automatic 15-minute and daily rollups for trend analysis
- Web dashboard for live status monitoring and historical reporting
- YAML configuration with validation and version tracking
- User management with role-based access control
- Windows Service that runs continuously in the background
Perfect for:
- Manufacturing plant IT/OT administrators
- Production supervisors monitoring critical systems
- Maintenance engineers tracking equipment connectivity
- Any organization needing reliable, local network monitoring
This guide covers installation and basic configuration to get you monitoring your network devices in minutes.
System Requirements
- Windows Server or Windows 10/11
- .NET 8.0 Runtime (included with installer)
- Administrator privileges for installation
- Network access to devices you want to monitor
Installation
Download and Run
- Download the ThingConnect Pulse installer
- Run as Administrator:
ThingConnect Pulse - Setup 1.0.0.exe - Follow the installation wizard
- Service will be automatically installed and started
Installation Details
The installer will:
- Install to
C:\Program Files\ThingConnect.Pulse - Create data directory at
C:\ProgramData\ThingConnect.Pulse - Register
ThingConnectPulseSvcWindows service - Create Start Menu shortcuts
First Login
- Open browser to
http://localhost:8080 - Create admin account on first visit
- Login with your credentials
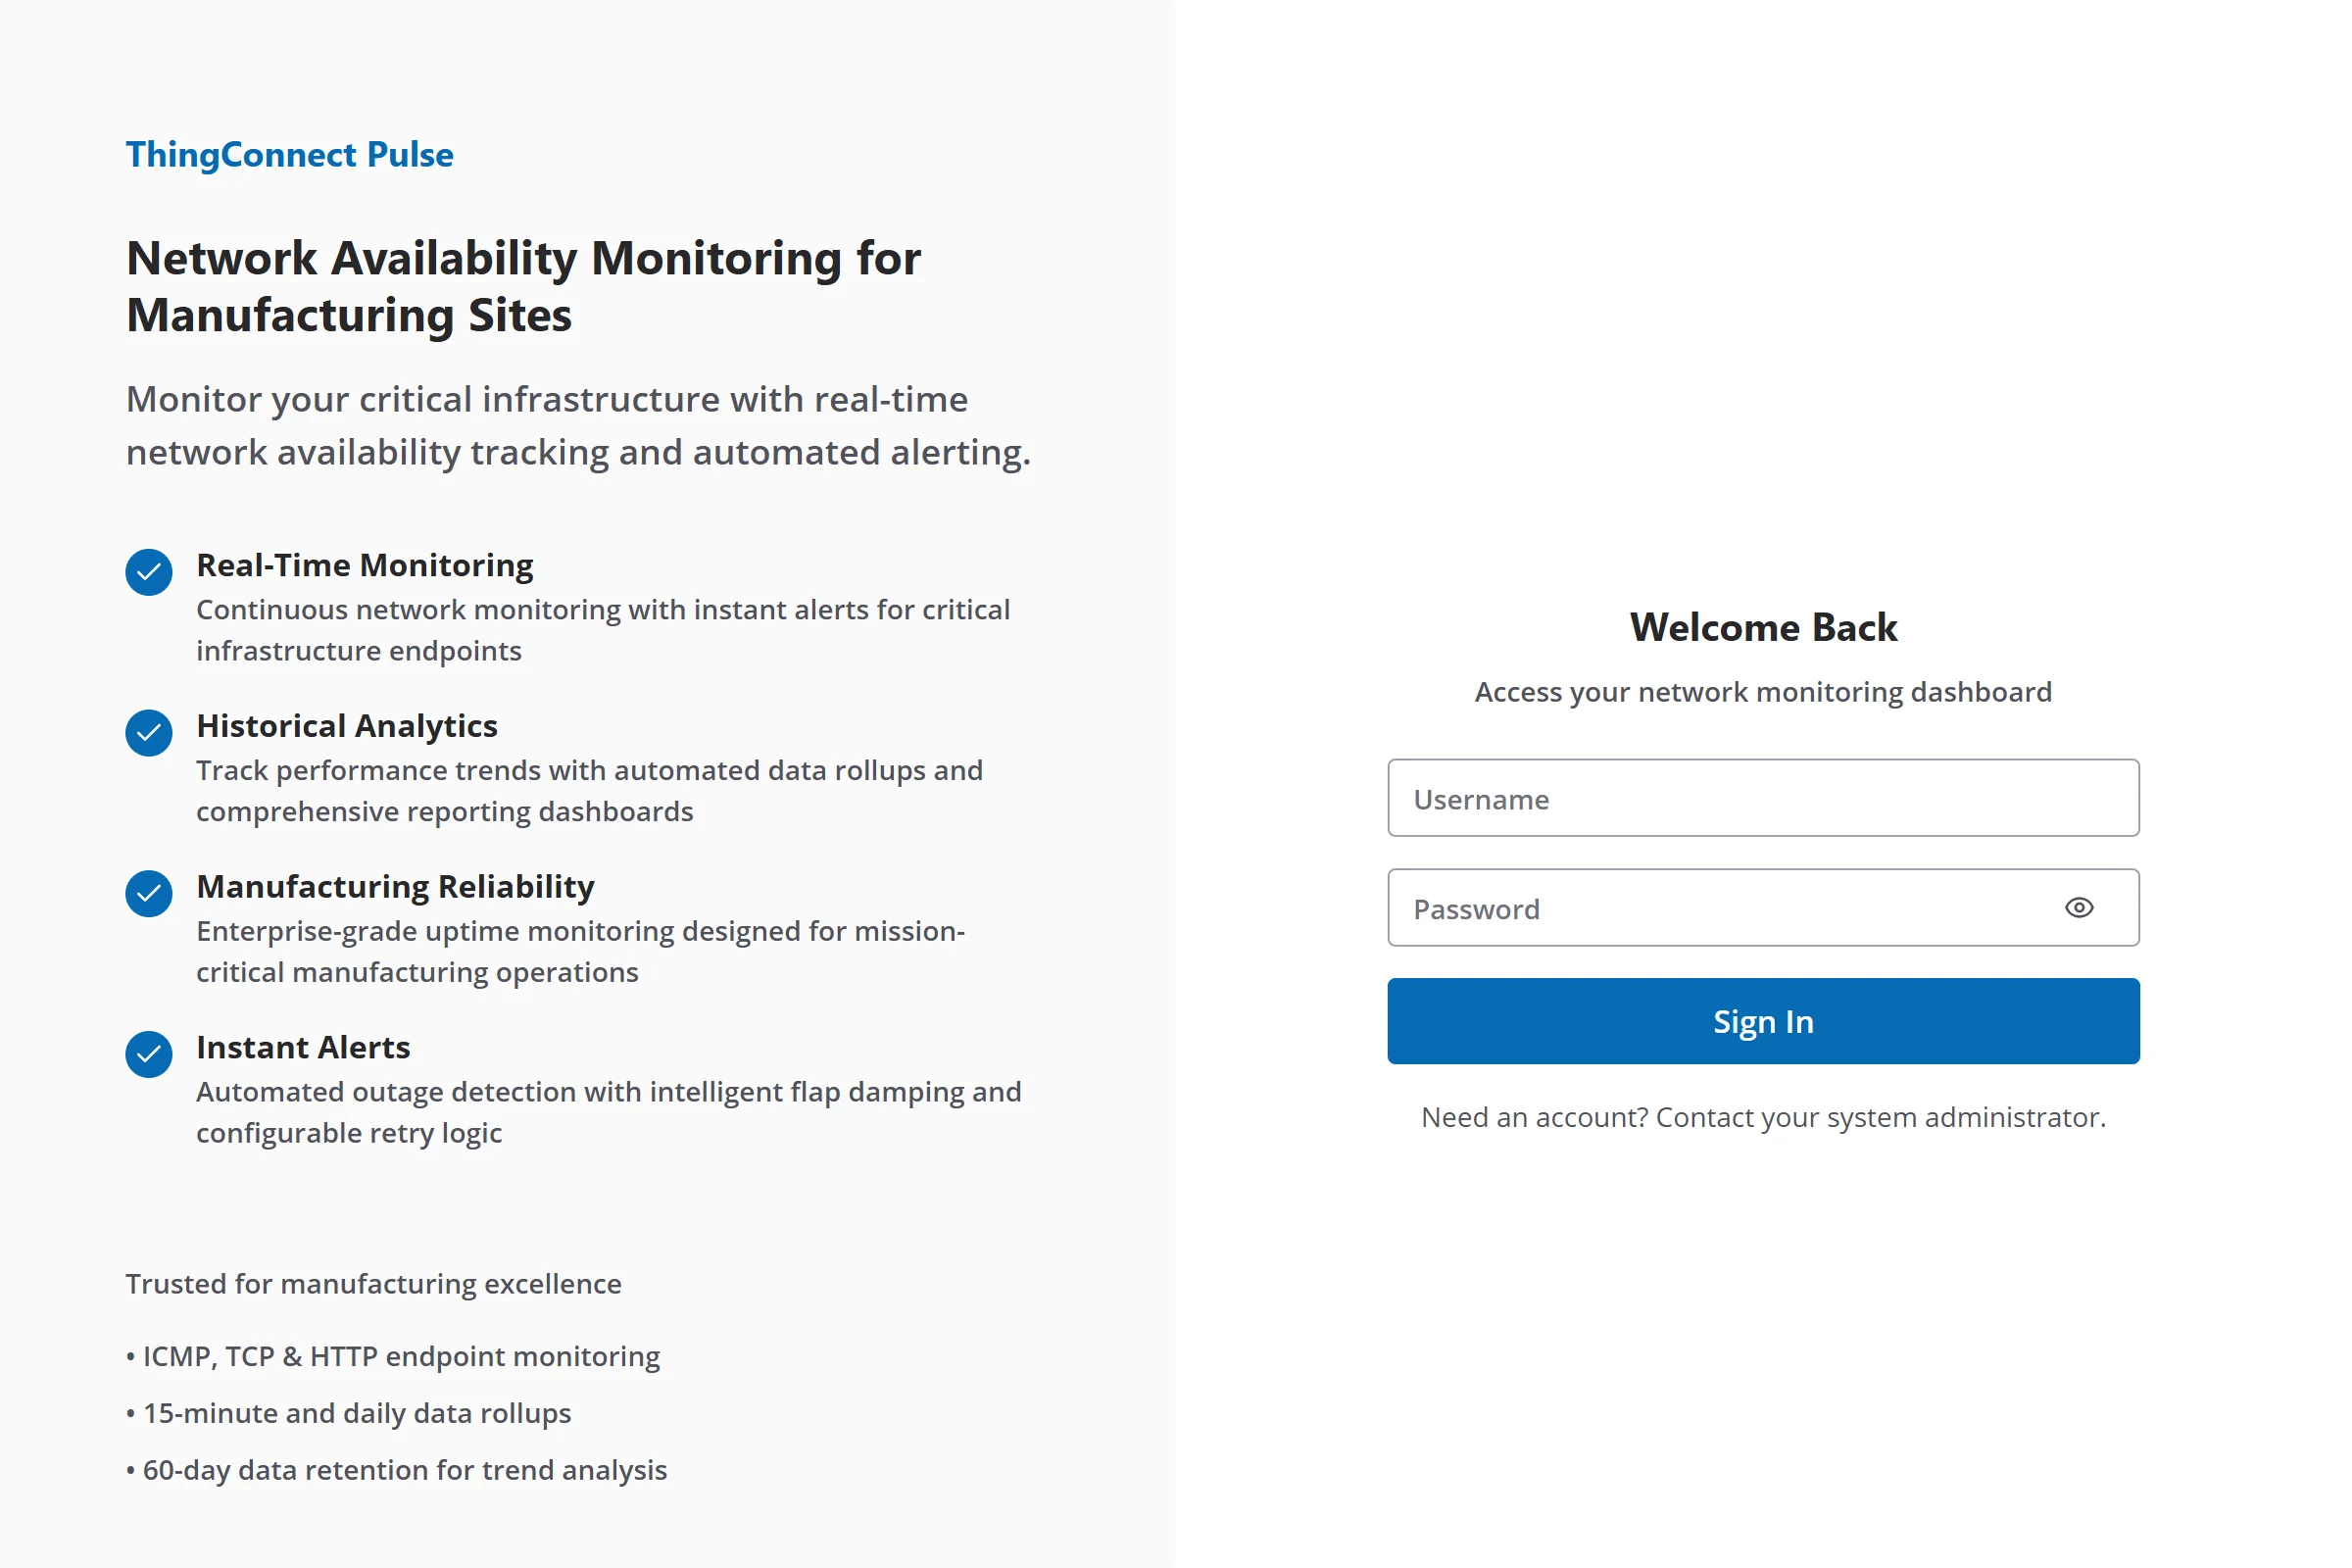
The login page welcomes you with key features and a clean interface for accessing your monitoring dashboard.
The web interface provides:
- Live status dashboard
- Historical data and charts
- Configuration management
- User administration
Basic Configuration
1. Access Configuration Page
- Navigate to Configuration in the main menu
- Click Edit Configuration to open the YAML editor
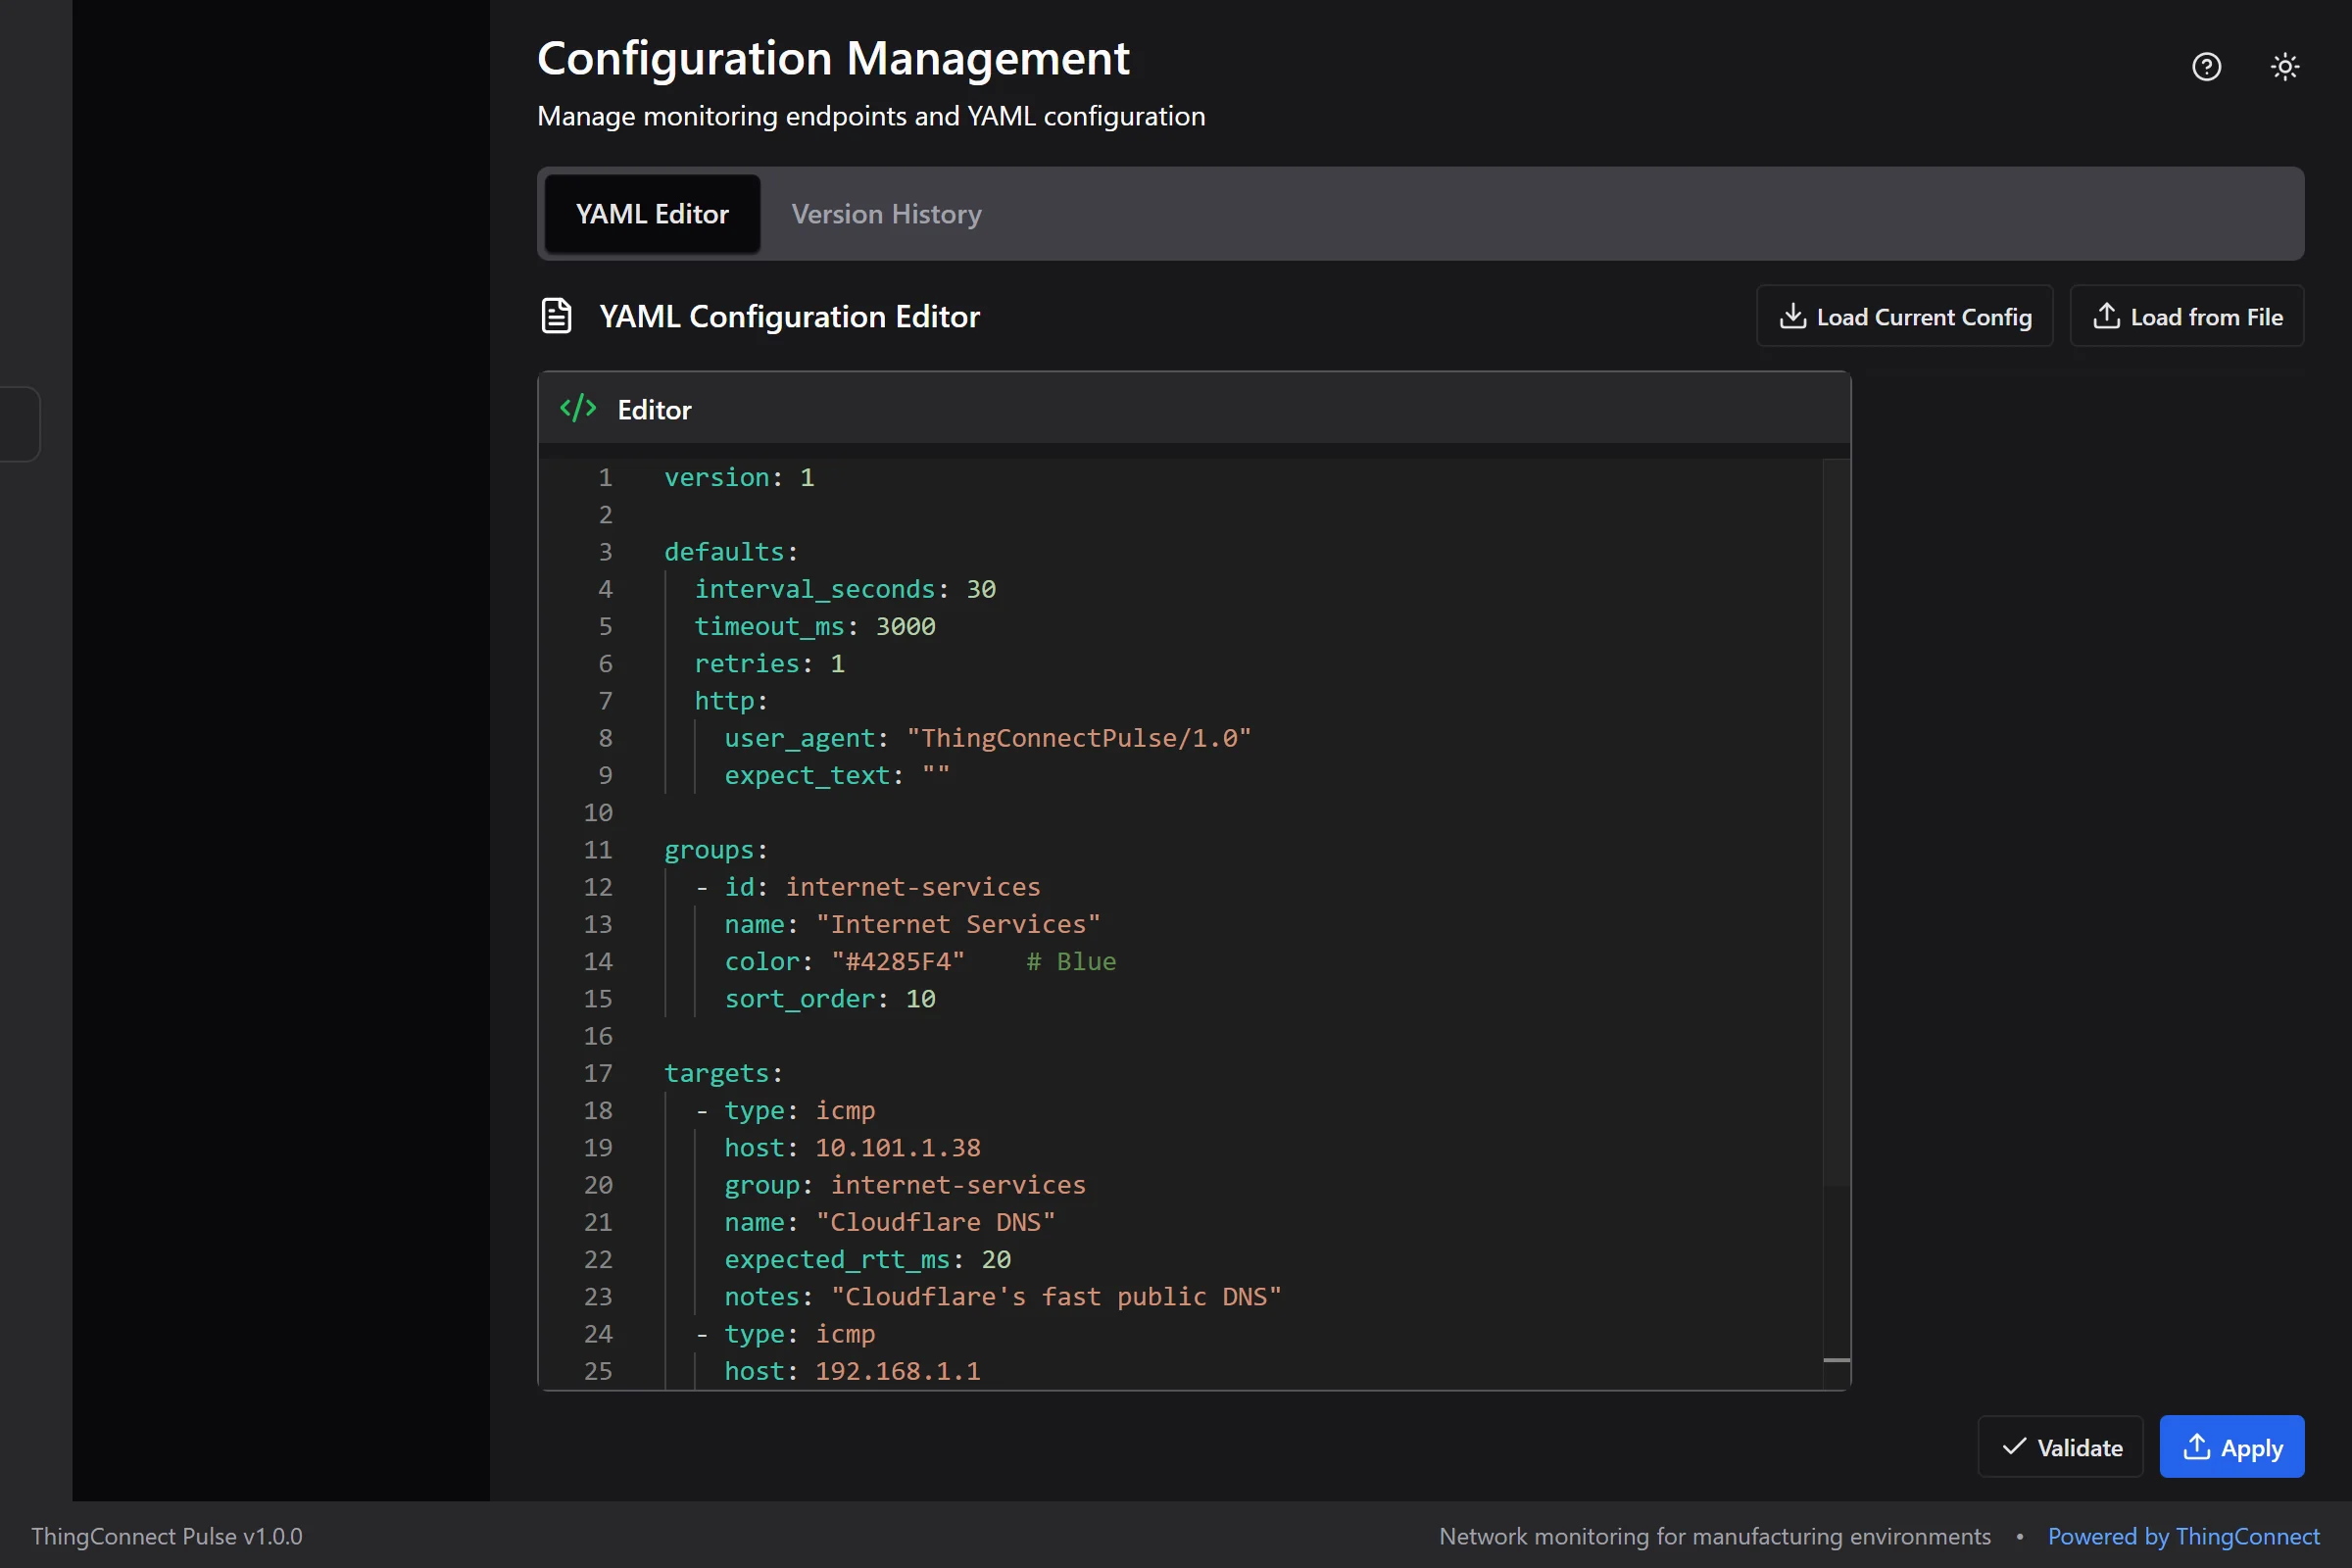
The configuration page provides a YAML editor with syntax highlighting and helpful documentation panels.
2. Add Your First Endpoints
Replace the sample configuration with your network devices:
# ThingConnect Pulse Configuration
endpoints:
  - name: "Main Router"
    host: "192.168.1.1"
    probes:
      - type: icmp
        interval: 30s
        timeout: 5s

  - name: "Web Server"
    host: "10.0.0.100"
    probes:
      - type: tcp
        port: 80
        interval: 60s
      - type: http
        url: "http://10.0.0.100/health"
        interval: 300s

  - name: "Database Server"
    host: "db.company.local"
    probes:
      - type: tcp
        port: 5432
        interval: 30s

groups:
  - name: "Infrastructure"
    endpoints: ["Main Router", "Database Server"]

  - name: "Web Services"
    endpoints: ["Web Server"]
3. Apply Configuration
- Click "Apply Configuration"
- Review the validation results
- Confirm to activate monitoring
4. Monitor Results
- Go to Dashboard to see live status
- Check History for trends and outages
- View individual Endpoint Details for specific devices
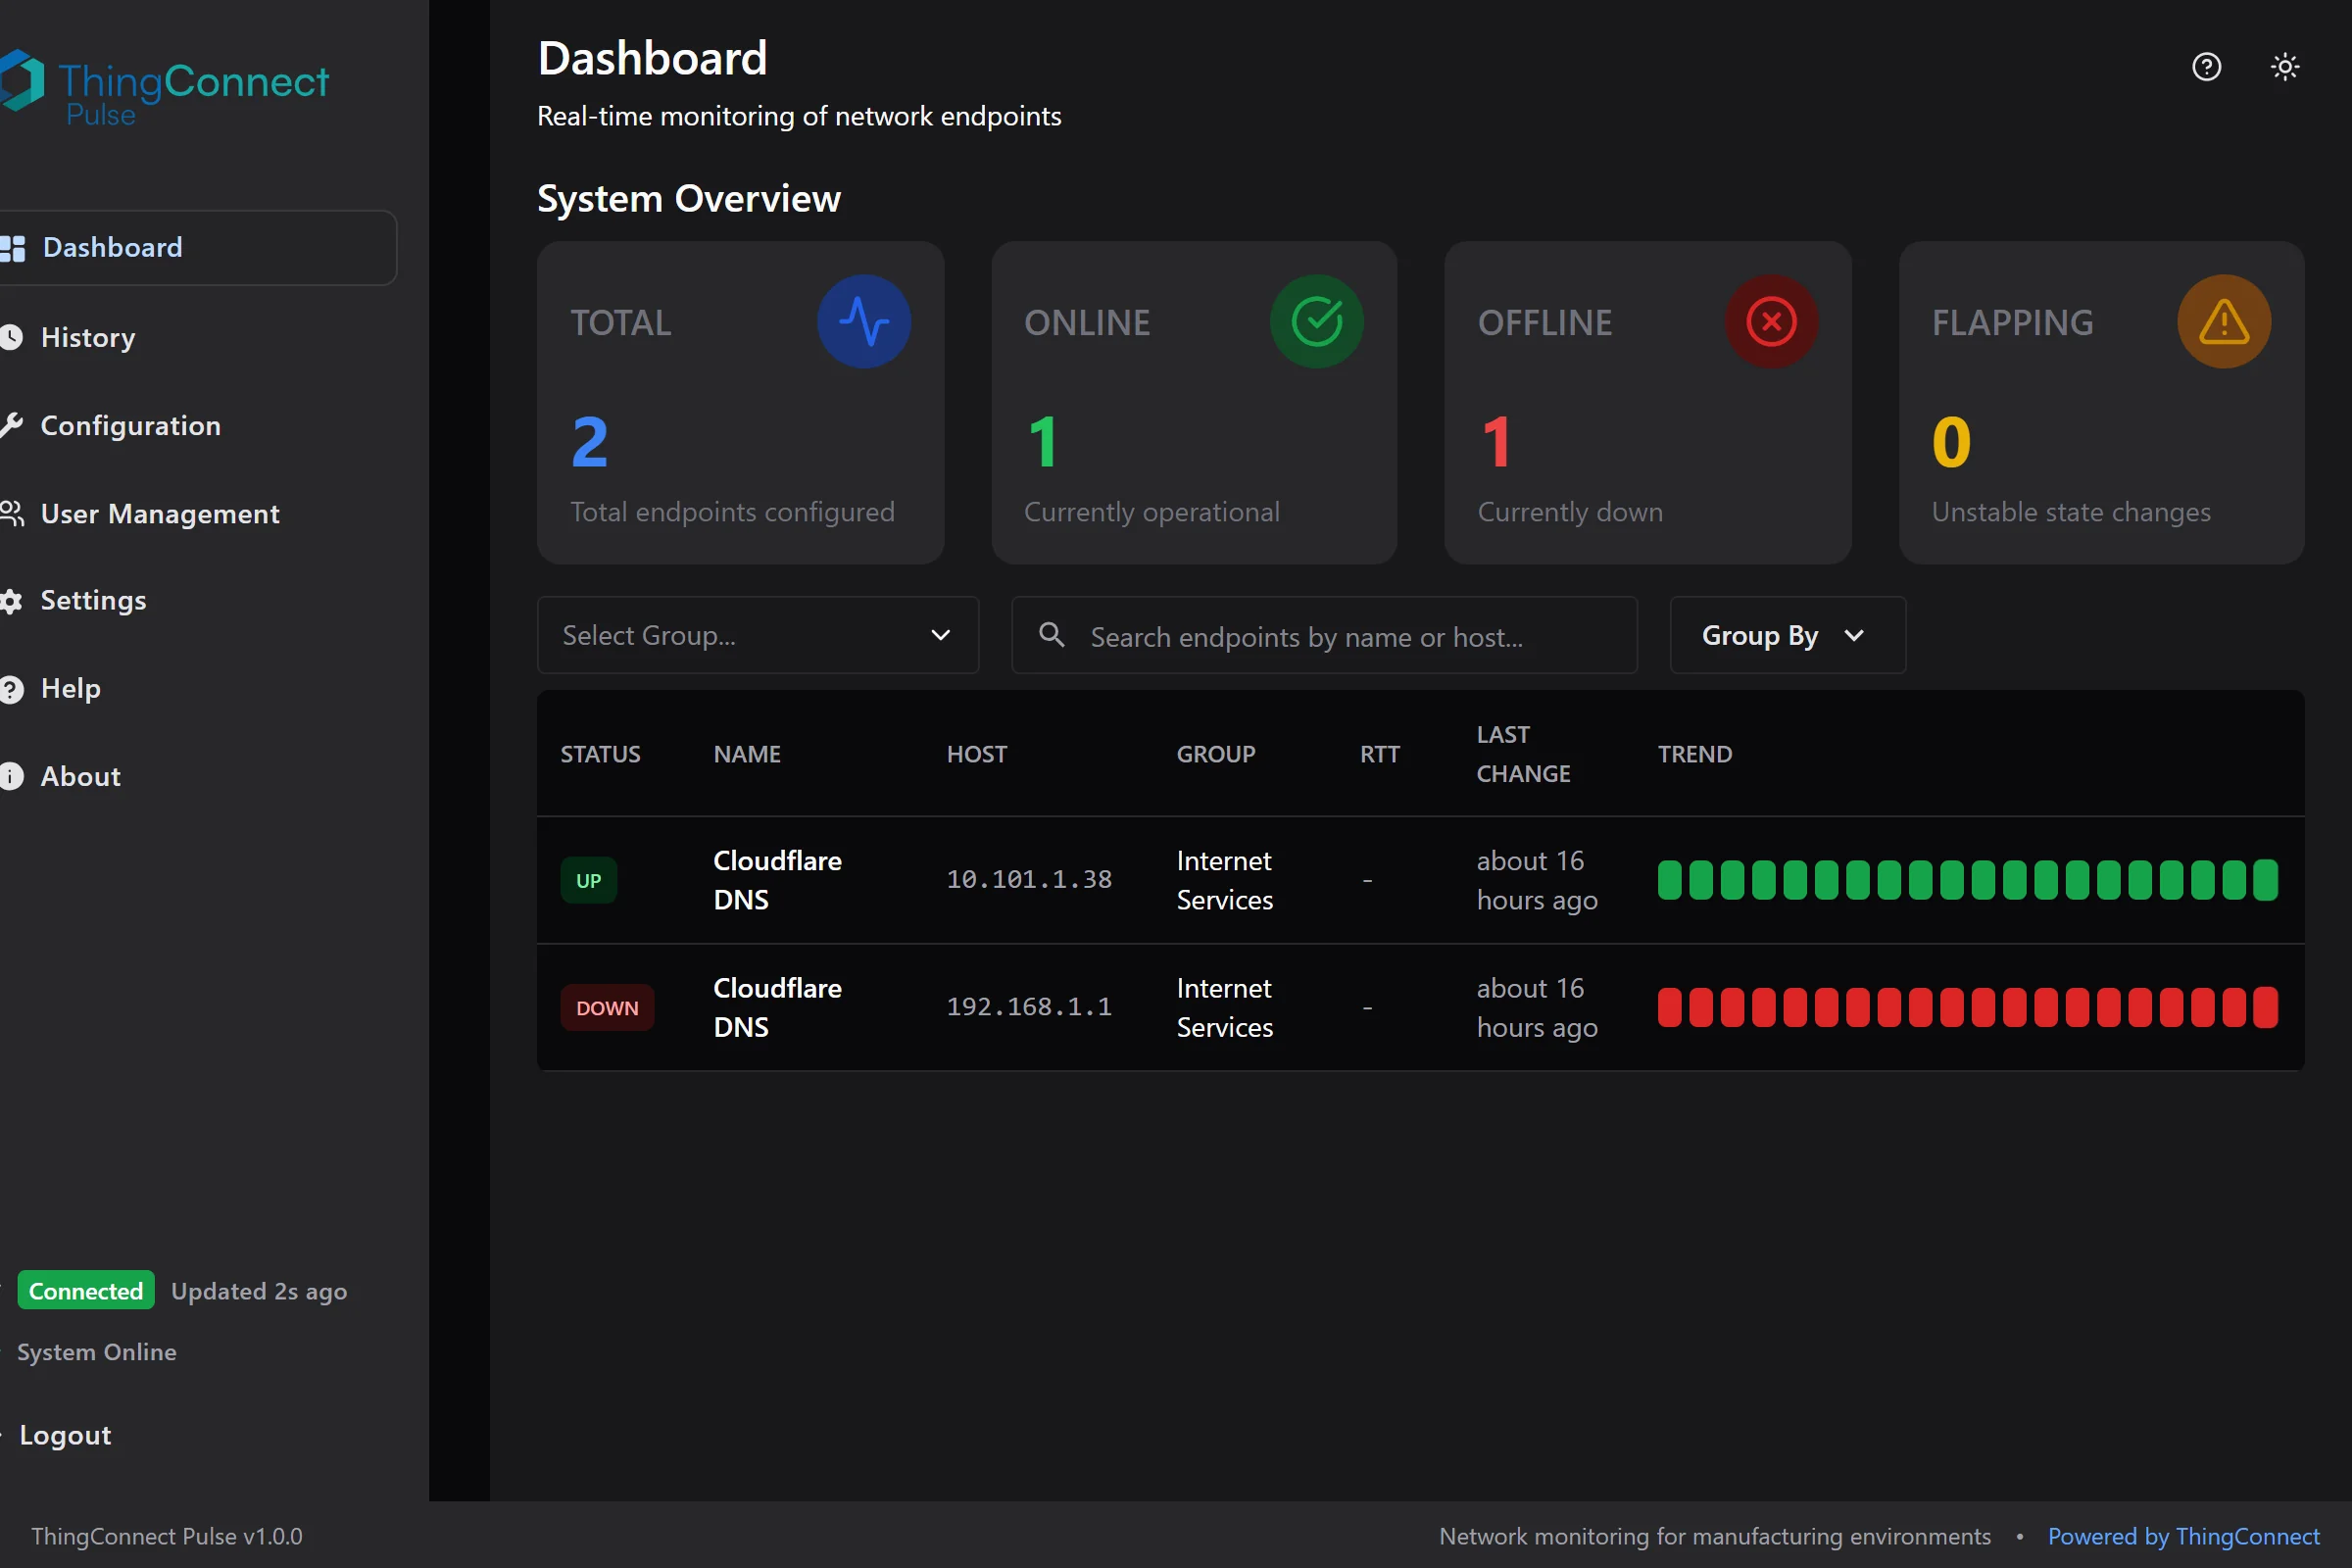
The dashboard provides real-time status monitoring with system overview, endpoint status table, and sparkline trend charts.
Monitoring Features
Probe Types
- ICMP Ping: Basic connectivity testing
- TCP Port: Service availability checks
- HTTP/HTTPS: Web service monitoring with status codes
Discovery Options
Monitor entire network ranges:
endpoints:
  - name: "Office Network"
    host: "192.168.1.0/24"  # Monitors entire subnet
    probes:
      - type: icmp
        interval: 60s

  - name: "Server Range"
    host: "10.0.0.*"        # Wildcard expansion
    probes:
      - type: icmp
        interval: 30s
Status Logic
- UP: 2 consecutive successful probes
- DOWN: 2 consecutive failed probes
- Flap damping prevents status oscillation
Data and Reporting
Historical Data
- Raw data: 60-day retention
- 15-minute rollups: Automatic aggregation
- Daily rollups: Long-term trends
- CSV export: Download historical data
Dashboard Features
- Live status with real-time updates
- Sparkline charts showing recent history
- Grouping and filtering capabilities
- Search by endpoint name or IP address
User Management
For detailed user account management, role assignment, and security features, see the User Management guide.
Service Management
Windows Service Control
- Command Line
- Windows Services
# Check service status
sc query ThingConnectPulseSvc

# Start/stop service
net start ThingConnectPulseSvc
net stop ThingConnectPulseSvc
- Open Services (
services.msc) - Find ThingConnect Pulse Service
- Right-click to Start, Stop, or Restart
- Set Startup Type as needed
Log Files
Service logs are stored in:
- Location:
C:\ProgramData\ThingConnect.Pulse\logs - Format: JSON structured logging
- Rotation: Daily rotation with cleanup
Next Steps
- YAML Configuration: Learn advanced configuration options
- Live Board and History: Explore the web interface
- Troubleshooting: Common issues and solutions
- API Reference: Integrate with external systems
Getting Help
- Check logs in
C:\ProgramData\ThingConnect.Pulse\logs - Verify service is running:
sc query ThingConnectPulseSvc - Test connectivity from the Pulse server to target devices
- Review configuration for syntax errors
Summary
You now have: ✅ ThingConnect Pulse installed and running ✅ Basic network monitoring configured ✅ Web dashboard access for live status ✅ Historical data collection active ✅ User accounts set up
Your devices are being monitored continuously with automatic outage detection and data rollups.